Research reveals new way of visualising blood test results
New method of displaying blood test results could aid patients with chronic kidney disease
Scientists have unveiled a data visualisation technique that could help those with chronic kidney disease understand and manage their conditions.
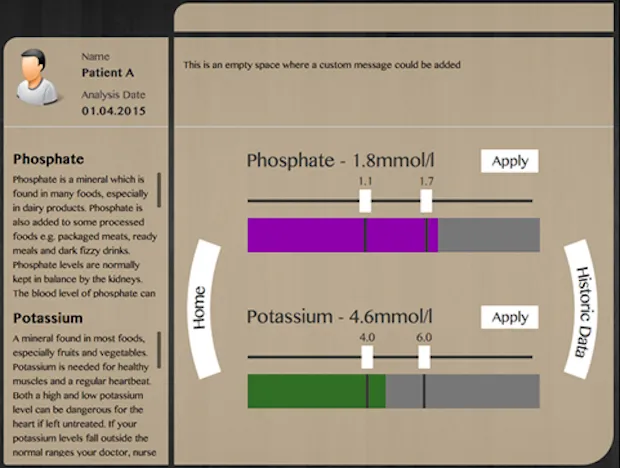
The goal of the study was to improve how regular blood tests data are visualised. The prototype that was created provides a graphic and colour-coded display of results. This enables clinicians to explain results to their patients with ease.
The study comes from a collaboration between Lancaster University, Newcastle University and Royal College of Art. Although the project has been primarily driven by researcher Jeremy Davenport, after he himself was diagnosed with CKD.
Davenport primarily was inspired to create this study when he realised that patients with CDK commonly failed to understand what the numerical values of their blood test results meant.

"From my personal experience, I felt there was an opportunity to develop a user-friendly way to show blood test results, rather than the old fashioned method which is currently being used and which only includes figures and complicated tables," said Davenport.
"We have an opportunity to represent data so that it is more accessible and visually appealing and engaging, with colours, shapes and designs, which is our inspiration for our prototype. Getting up to date information about medical conditions and understanding how to manage them is crucial to living with a chronic illness and by using visual aids, patients can regain some confidence and more control."
The new method will be undergoing patient trials with the NHS Kendal Dialysis Unit, led by Heather Hill, Renal Dietitian Lancashire Teaching Hospitals Trust. Results are expected within the next year.
Positive feedback has already been received from the early stages of their testing. The team believes that this new way of presenting blood tests to their patients will yield a wide array of benefits for an untold number of conditions.
-
 ITPro is 20!
We take a look back on the past two decades since ITPro launched...
-
 Cyber experts issue alert after two ransomware groups team up on ‘unprecedented’ threat campaign
News The tie-up includes a new model of industrialized ransomware deployment that significantly lowers the barrier to entry for cyber crime

