
Count your sensors
PRTG's Ajax-based web interface is a colourful affair and the home page provides a link to the new Configuration Guru. This runs through initial setup which includes providing various default system credentials, enabling cloud and web site monitoring if required and adding your network subnets.
It then runs a network discovery routine and starts populating its database with the systems it finds. PRTG automatically adds sensors for every entity it discovers and it's here that you'll see how quickly they can get used up.
Our lab test setup included a firewall, a 48-port HP Gigabit switch, Hyper-V and VMware hosts, four Windows 7 and five other Windows Server 2008 R2 systems, a network laser printer and two NAS appliances. Add in our AD Domain Controller plus a couple of cloud and Internet connections and we were down by over 330 sensors right from the start.
However, the big advantage of PRTG's licensing is you can delete sensors you don't need and return them to the pool for use elsewhere. Ipswitch's WhatsUpGold, for example, doesn't offer the same level of flexibility as it's licensed only by device.

Groups can streamline systems management but keep an eye on your sensor count as they will get used up very quickly
Hierarchical groups
The PRTG web console keeps your systems neatly organised with hierarchical groupings. You can manually move systems to other groups and each one inherits settings such as login credentials and discovery schedules from the parent group or can have their own settings.
Each sensor is colour coded so you can see at a glance which are up, down, paused or in a warning state. Hover the mouse pointer over a sensor and a graph will pop up showing live data. You can also select a sensor and drill down for more information.
We use Google Analytics on the Binary Testing web site and found this new sensor very useful. To configure it we provided our Analytics login details, the eight digit profile ID and the number of days to query data.
Channels determine which Analytics values to pull in and preset channels include all visits, new visit percentages, page views, Ad Clicks, Ad Costs, Goal Completions and downtime. As with all sensors, selecting it takes you to a page with overview of activity and options to view live data or periods from two days up to a year.

We were able to create a Google Analytics sensor to keep an eye on our web site activity

-
 "We are at a defining moment in our society relative to how we live and how we work.” HP's interim CEO says firm aims to ready businesses for the future of work with a raft of new launches
The tech giant used its HP Imagine event in New York to make multiple announcements across myriad product lines
-
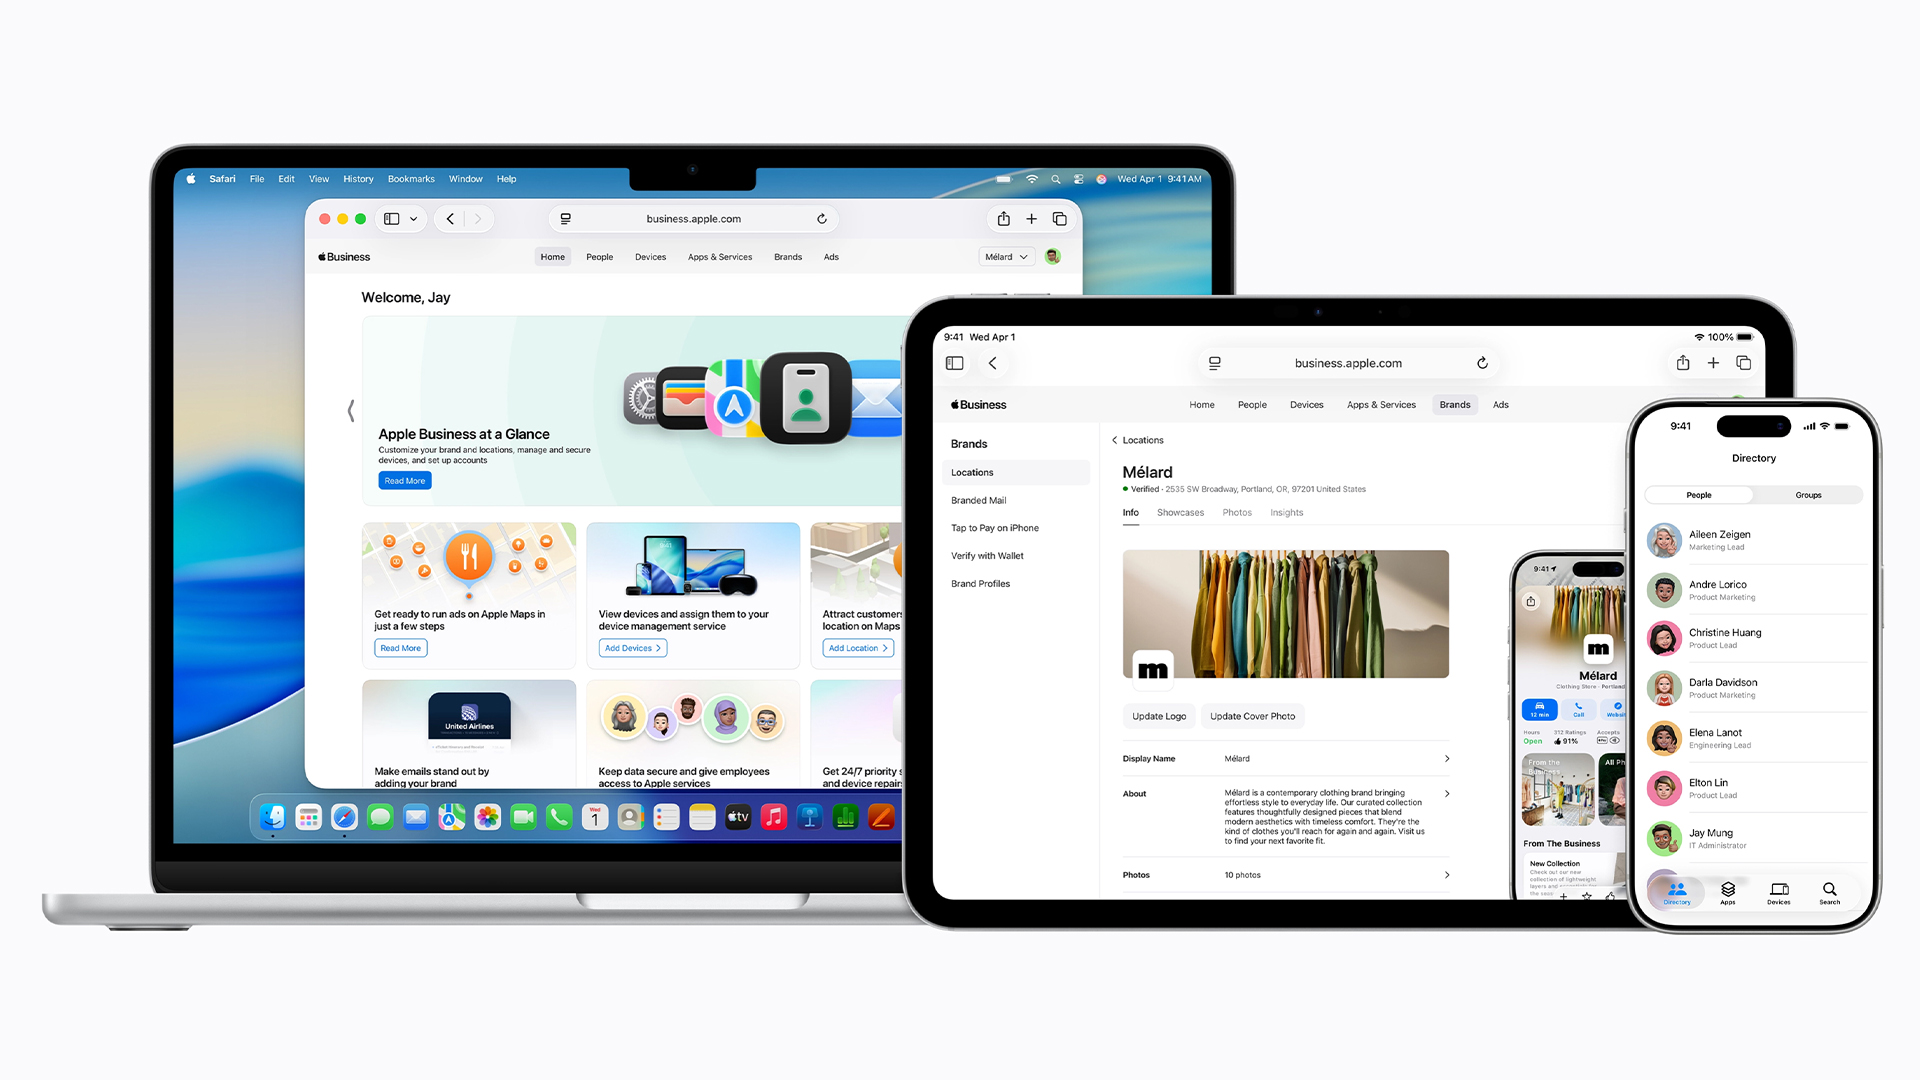 Apple Business: Everything you need to know about the all-new enterprise platform
News The new platform will replace the previous business suites Apple offered, with more focus on helping businesses grow through Apple Maps
-
 UK firms regret software spending as tool sprawl causes IT headaches
News Spur-of-the-moment software purchases are creating fragmented tech stacks, and it’s harming productivity


