AdRem NetCrunch 10.7 review: Monitoring in a flash
Not the cheapest, but a worthy choice for anyone seeking a quick, easy way to get the big network picture

-
+
Speedy deployment
-
+
Hyper-V monitoring has been improved
-
+
Detailed and well-designed console
-
-
Poor value for L2 monitoring

Some network monitoring solutions can be a pain to set up, but if speed is your concern then worry not: AdRem’s NetCrunch gets you up and running in a flash. We installed the Server and Console components on a Windows Server 2019 host system, followed the quick start discovery wizard – and, just 15 minutes later, found ourselves looking at a comprehensive read-out of our entire labs network.
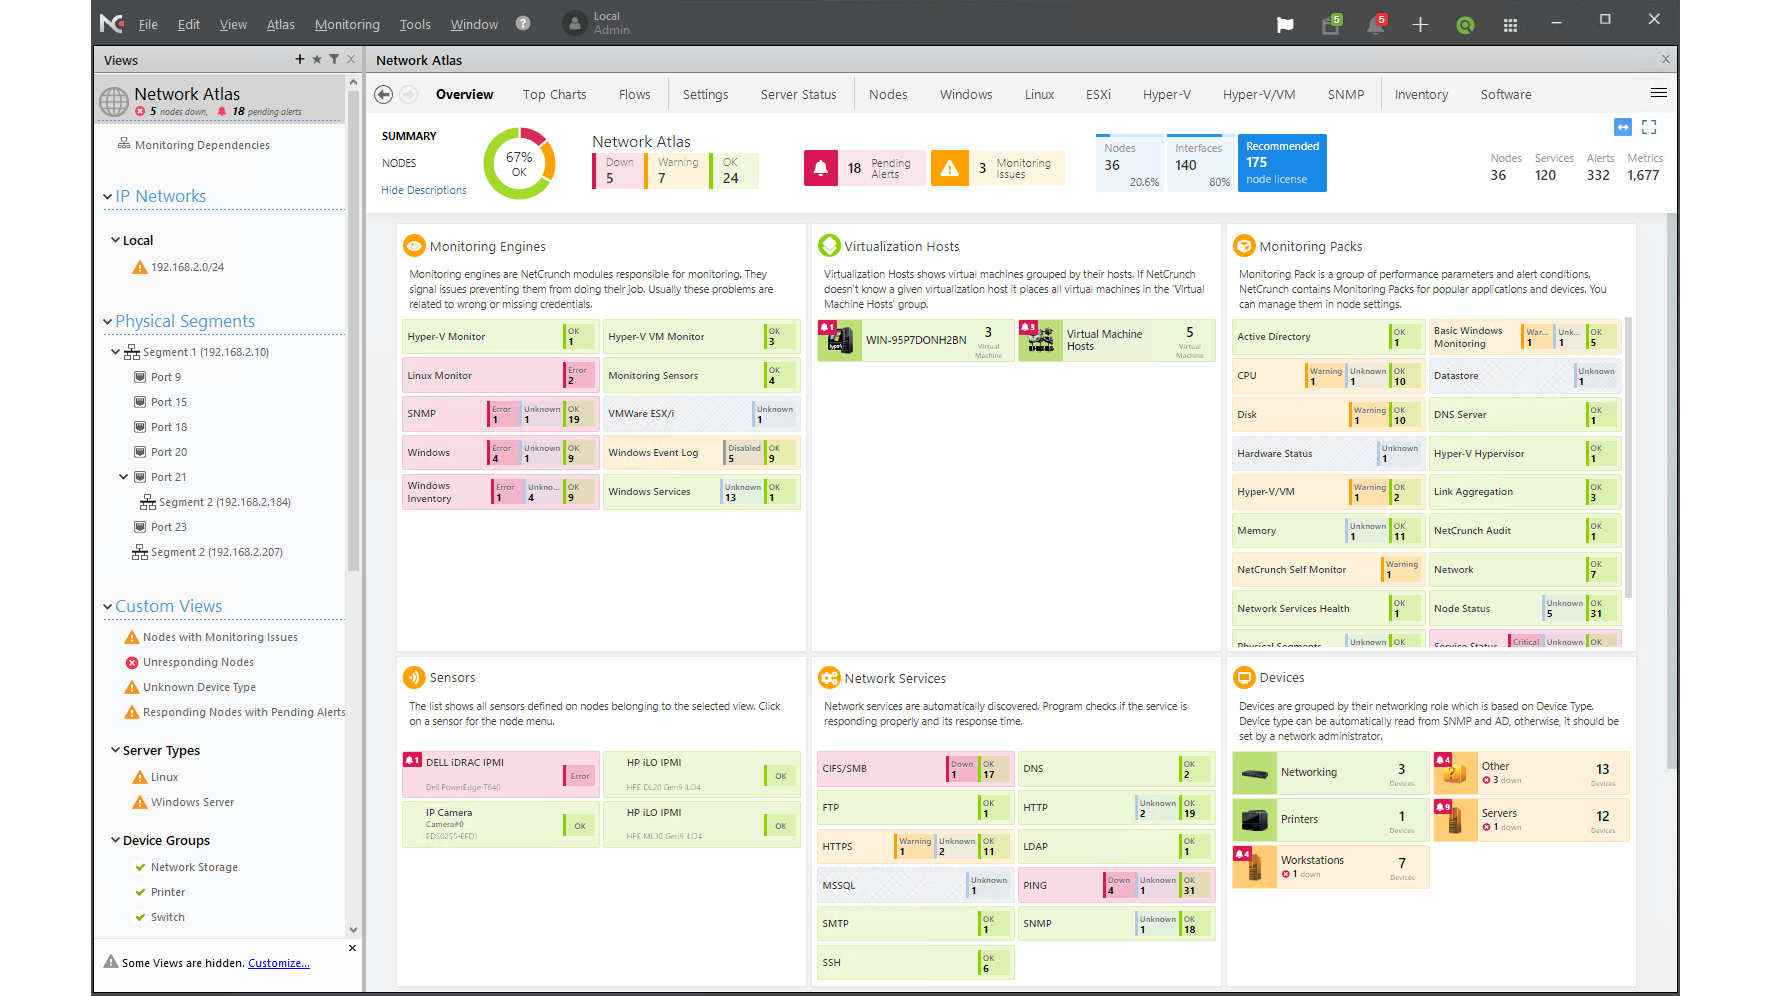
It was easy to navigate too, thanks to NetCrunch’s informative and intuitive console. The Atlas page provides a colour-coded overview of all network devices, with the Smart Pages feature automatically applying filters based on the device categories selected in the left pane. If you want to create your own custom views, that’s possible as well.
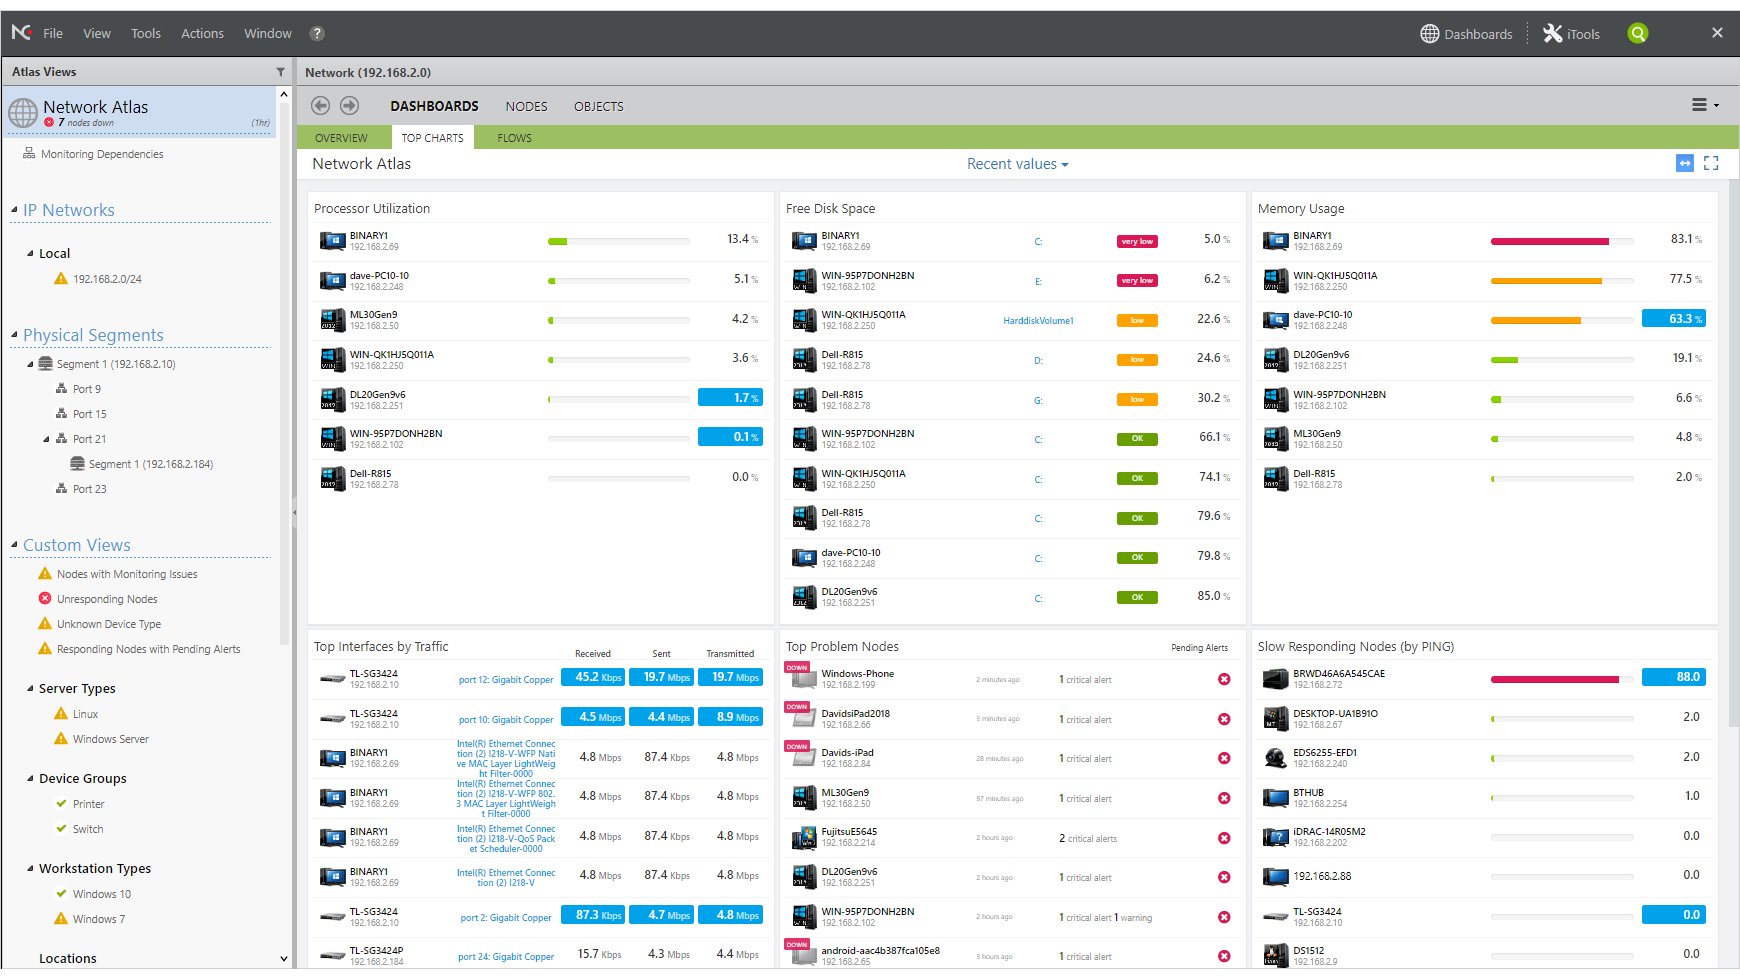
The Top 10 chart reveals the systems on your network with the highest CPU, memory and storage usage, along with those with high levels of network traffic or other issues. The information here can be dragged around to suit – and if the default views don’t cover the details you’re interested in, you can create your own with dynamic charts and performance counters.
Another console feature that SMBs will appreciate is the Nodes Overview. Designed for monitoring smaller networks, this presents a colourful graphical status report on all network devices, which is easily customised using drag-and-drop manoeuvres. Any services or sensors that have an issue are highlighted: click on the icon and it’ll take you to a view of all member systems, where you can deep-dive for more troubleshooting.
Setting up exactly what gets monitored is a breeze, as NetCrunch scans all devices and automatically assigns the most appropriate services and sensors to each one. AdRem’s “Monitoring Packs” group together performance data and alerts for specific devices and services, and in most cases their default values will be all you need.

There are plenty of packs on offer, too. This latest version adds new packs for monitoring CyberPower UPS units, Riverbed WAN appliances and Sophos XG firewall hardware. Fans of virtualisation will also welcome the updated Hyper-V pack: previously, this was a poor cousin to the VMware version, but it now delivers the same amount of information about host utilisation and VM activity.
Simple alerting scripts are set up automatically for all relevant Packs; these are easily customised, and escalation scripts can be used to set a sequence of alerts and actions to follow should things go pear-shaped.
Sign up today and you will receive a free copy of our Future Focus 2025 report - the leading guidance on AI, cybersecurity and other IT challenges as per 700+ senior executives
A final feature worth mentioning is NetCrunch’s Layer 2 maps of network segments, which show bidirectional, real-time views of network traffic passing between each node. If you add an IP camera sensor and assign a snapshot image widget, you can even view its feed directly from the network map.
NetCrunch doesn’t score quite so highly on mobile support. There are no apps for Android or iOS, but you can connect directly to the NetCrunch host from either a desktop or mobile web browser. This gives you access to all the same information as the native console, although you don’t get access to the NetCrunch server settings or device properties.
Another foible of NetCrunch is its slightly confusing licensing system: you pay based on the total number of either nodes or interfaces in use – whichever is the greater. That makes it poor value if you want Layer 2 monitoring for all your switch ports. The price shown above is for the 250 node/interface Monitoring Suite, which includes AdRem’s Advanced Monitoring & Alerting and Advanced Configuration modules.
Those on tight budgets might, therefore, choose to look elsewhere, but there’s no denying that NetCrunch takes a lot of the pain out of network monitoring. It offers a great set of features from an informative central console and it can’t be beaten for deployment speed.
Dave is an IT consultant and freelance journalist specialising in hands-on reviews of computer networking products covering all market sectors from small businesses to enterprises. Founder of Binary Testing Ltd – the UK’s premier independent network testing laboratory - Dave has over 45 years of experience in the IT industry.
Dave has produced many thousands of in-depth business networking product reviews from his lab which have been reproduced globally. Writing for ITPro and its sister title, PC Pro, he covers all areas of business IT infrastructure, including servers, storage, network security, data protection, cloud, infrastructure and services.
-
 95% of organizations don’t fully trust their cybersecurity vendors – here’s why
News Organizations are struggling to assess vendor credibility as trust becomes a key factor in risk management.
By Daniel Todd Published
-
 Meta engineer trusted advice from an AI agent, ended up exposing user data
News The internal security incident exposed sensitive user data to unauthorized employees
By Ross Kelly Published
-
 Stryker hackers struck by FBI in domain seizure campaign
News The domain seizures come hot on the heels of Handala's devastating attack on the medical tech firm
By Emma Woollacott Published
